
Digital Maturity Assessment 2024 – Section One
Top Level Findings
Overview
The picture presented by the data from the digital maturity assessment at theme level (E.g., aggregated from 20 sections into 3 categories – Readiness, Capabilities and Infrastructure) suggests less homogeneity than reported in 2023, and a greater divide between the best and worst-performing health and social care systems across the country.
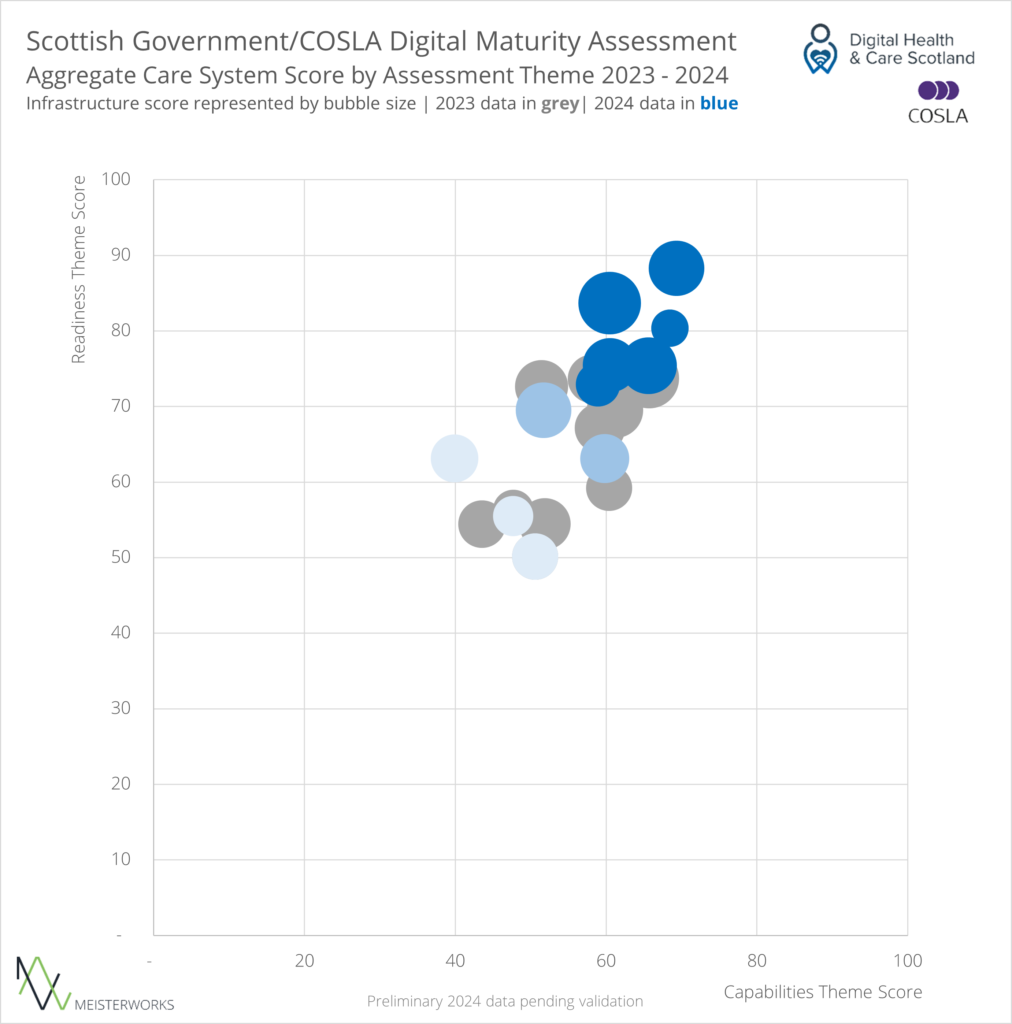
[A scatter chart showing aggregated results for each care system.]
Alongside this development, the share of the population served by a healthcare and social care system we would class as ‘Follower’ or ‘Mid-field’ has increased by around 10 percent and now represents just over a third of the overall Scottish population.
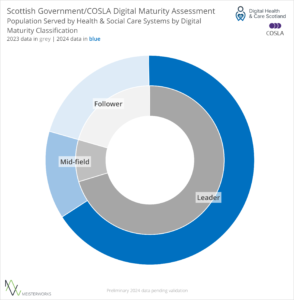
[A doughnut chart showing the share of population served by leaders, midfielders and followers in digital maturity.]